# 介绍
[Prometheus](https://prometheus.io/) is an open-source sy
stems monitoring and alerting toolkit originally built at SoundCloud. Since its inception in 2012, many companies and organizations have adopted Prometheus, and the project has a very active developer and user com
munity. It is
Now a standalone open source project and maintained independently of any company. Prometheus joined the Cloud Native Co
mputing Foundation in 2016 as the second hosted project, after Kubernetes.
[Grafana](https://grafana.com/) is open source visualization and analytics software. It allows you to query, visualize, alert on, and explore your metrics no matter where t
hey are stored. In plain English, it provides you with tools to turn your time-series database (TSDB) data into beautiful graphs and visualizations.
# 部署 Prometheus
我们使用 helm 来安装,首先安装 promethus 的仓库。
```bash
helm repo add prometheus-com
munity https://prometheus-com
munity.github.io/helm-charts
```
创建 Prometheus 命名空间。
```bash
kubectl create namespace prometheus
```
部署 Prometheus。
```bash
helm install prometheus prometheus-com
munity/prometheus \
--namespace prometheus \
--set alertmanager.persistentVolume.storageClass="gp2" \
--set server.persistentVolume.storageClass="gp2"
```
输出的这个地址我们后面会用到。
```bash
NOTES:
The Prometheus server can be accessed via port 80 on the following DNS name from within your cluster:
prometheus-server.prometheus.svc.cluster.local
```
确认 `prometheus` 命名空间中的所有 Pod 均处于 `READY` 状态。
```bash
kubectl get pods -n prometheus
```
输出如下。
```bash
NAME READY STATUS RESTARTS AGE
prometheus-alertmanager-58666cd457-x6n7r 2/2 Running 0 86s
prometheus-kube-state-metrics-5b8f9bdbbd-6hz7m 1/1 Running 0 86s
prometheus-node-exporter-2btvc 1/1 Running 0 87s
prometheus-node-exporter-2mps4 1/1 Running 0 87s
prometheus-node-exporter-lzjbg 1/1 Running 0 87s
prometheus-node-exporter-xxqcm 1/1 Running 0 87s
prometheus-pushgateway-55b7f76c47-rmkb7 1/1 Running 0 86s
prometheus-server-648894fdf8-zlgg4 2/2 Running 0 86s
```
为了访问 prometheus,我们做一下端口转发。
```bash
kubectl port-forward -n prometheus deploy/prometheus-server 8080:9090
```
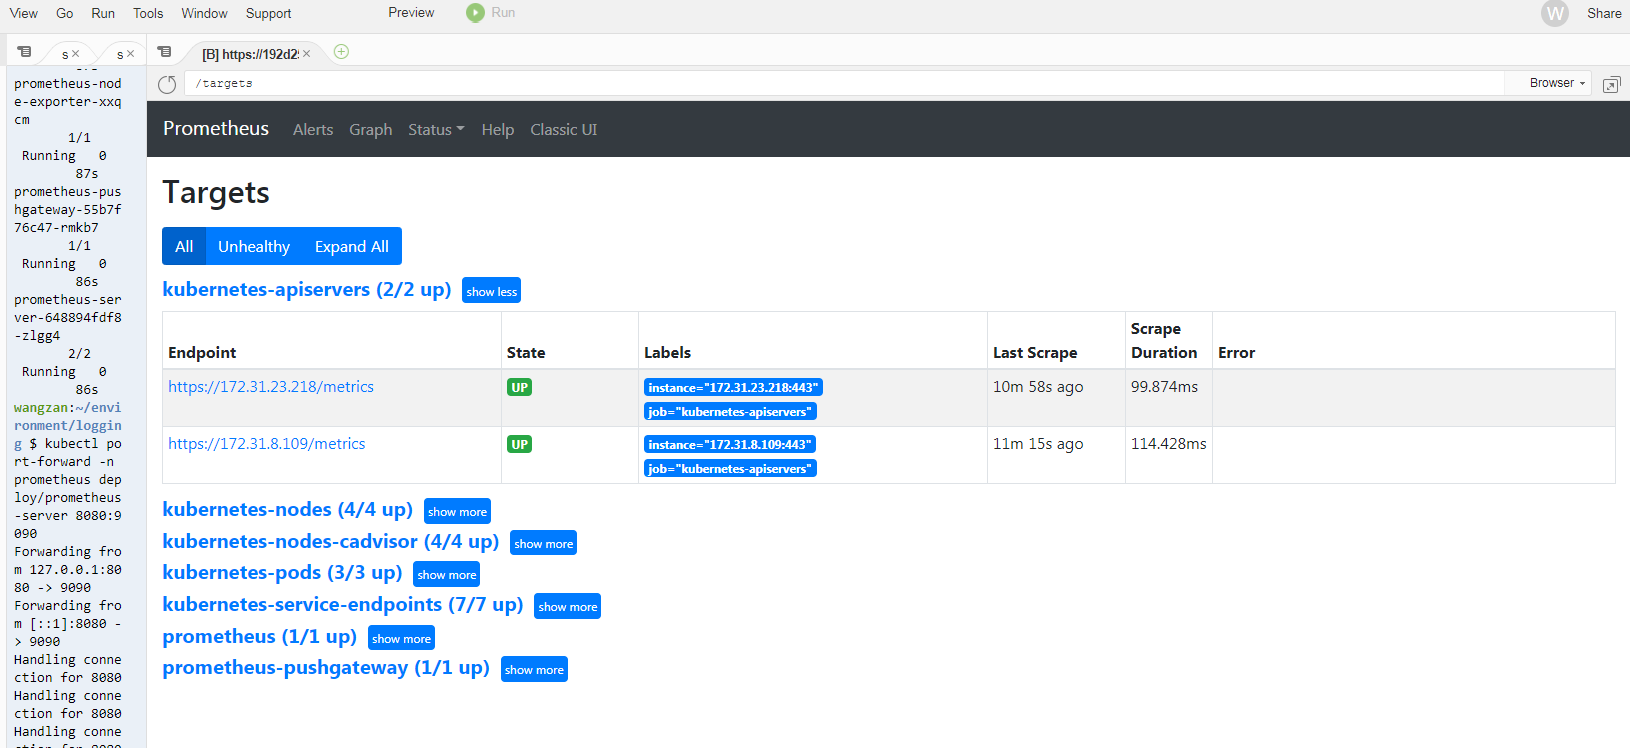
在 Cloud9 环境里面,点击 **Tools / Preview / Preview Running Application**,在 URL 末端
添加如下
```bash
/targets
```
可以看到如下信息。
# 部署 Grafana
grafana 也是使用 helm 安装,首先配置好 grafana 的仓库。
```bash
helm repo add grafana https://grafana.github.io/helm-charts
```
然后部署 grafana。
```bash
kubectl create namespace grafanahelm install grafana grafana/grafana \ --namespace grafana \ --set persistence.storageClassName="gp2" \ --set adminPassword='Wangzan@18' \ --set datasources."datasources\.yaml".apiVersion=1 \ --set datasources."datasources\.yaml".datasources[0].name=Prometheus \ --set datasources."datasources\.yaml".datasources[0].type=prometheus \ --set datasources."datasources\.yaml".datasources[0].url=http://prometheus-server.prometheus.svc.cluster.local \ --set datasources."datasources\.yaml".datasources[0].access=proxy \ --set datasources."datasources\.yaml".datasources[0].isDefault=true \ --set service.type=LoadBalancer
```
确定 grafana 是不是部署完成。
```bash
kubectl get all -n grafana
```
输出如下。
```bash
NAME READY STATUS RESTARTS AGEpod/grafana-5d6dcc4b46-dl95q 1/1 Running 0 59sNAME TYPE CLUSTER-IP EXTERNAL-IP PORT(S) AGEservice/grafana LoadBalancer 10.100.53.152 a5cf235fc45974b80bfbece27c104564-1893187232.eu-west-1.elb.amazonaws.com 80:32042/TCP 60sNAME READY UP-TO-DATE AVAILABLE AGEdeployment.apps/grafana 1/1 1 1 60sNAME DESIRED CURRENT READY AGE
replicaset.apps/grafana-5d6dcc4b46 1 1 1 60s
```
直接打开 ELB 的地址即可访问,
密码就是我们前面定义的,如果忘记了,可以通过下面命令
获取。
```bash
kubectl get secret --namespace grafana grafana -o jsonpath="{.data.admin-password}" | base64 --decode ; echo
```
##
修改为 Ingress
```yaml
apiVersion: networking.k8s.io/v1kind: Ingress
Metadata: namespace: grafana name: grafana annotations: kubernetes.io/ingress.class: alb alb.ingress.kubernetes.io/listen-ports: '[{"HTTP": 80}, {"HTTPS": 443}]' alb.ingress.kubernetes.io/target-group-attributes: sticki
ness.enabled=true,sticki
ness.lb_cookie.duration_seconds=600 alb.ingress.kubernetes.io/scheme: internet-facing alb.ingress.kubernetes.io/conditions.grafana: > [{"field":"host-header","hostHeaderCon
fig":{"values":["grafana.wzlinux.com"]}}] alb.ingress.kubernetes.io/group.name: wzlinux alb.ingress.kubernetes.io/ssl-redirect: '443' alb.ingress.kubernetes.io/certificate-arn: arn:aws:acm:eu-west-1:921283538843:certificate/e55a72ae-d9b5-4f77-bf6d-242691105231 alb.ingress.kubernetes.io/target-type: ipspec: rules: - http: paths: - path: / pathType: Prefix backend: service: name: grafana port: number: 80
```
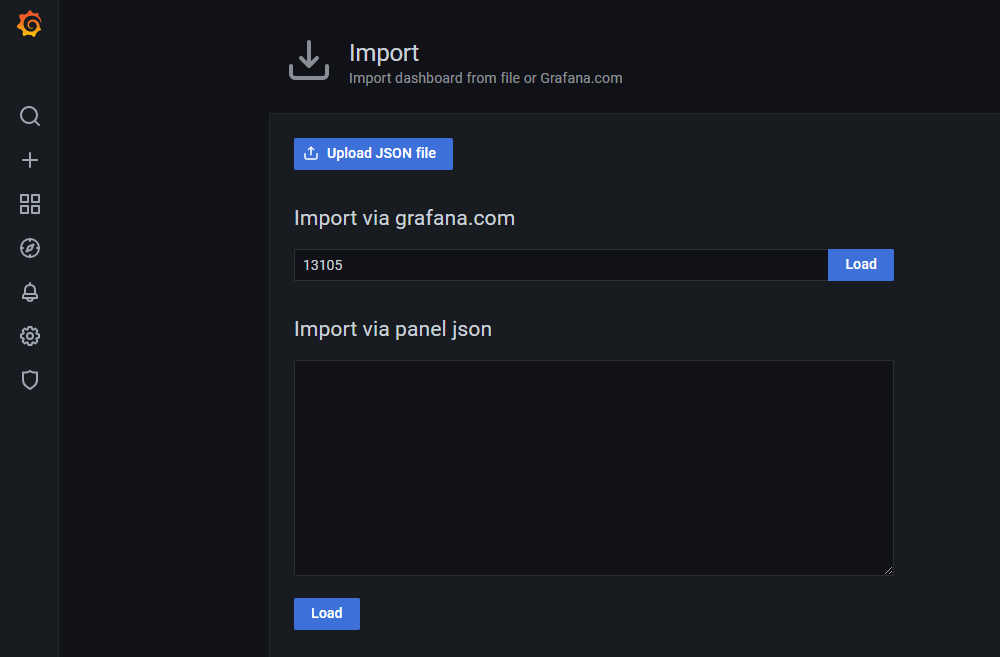
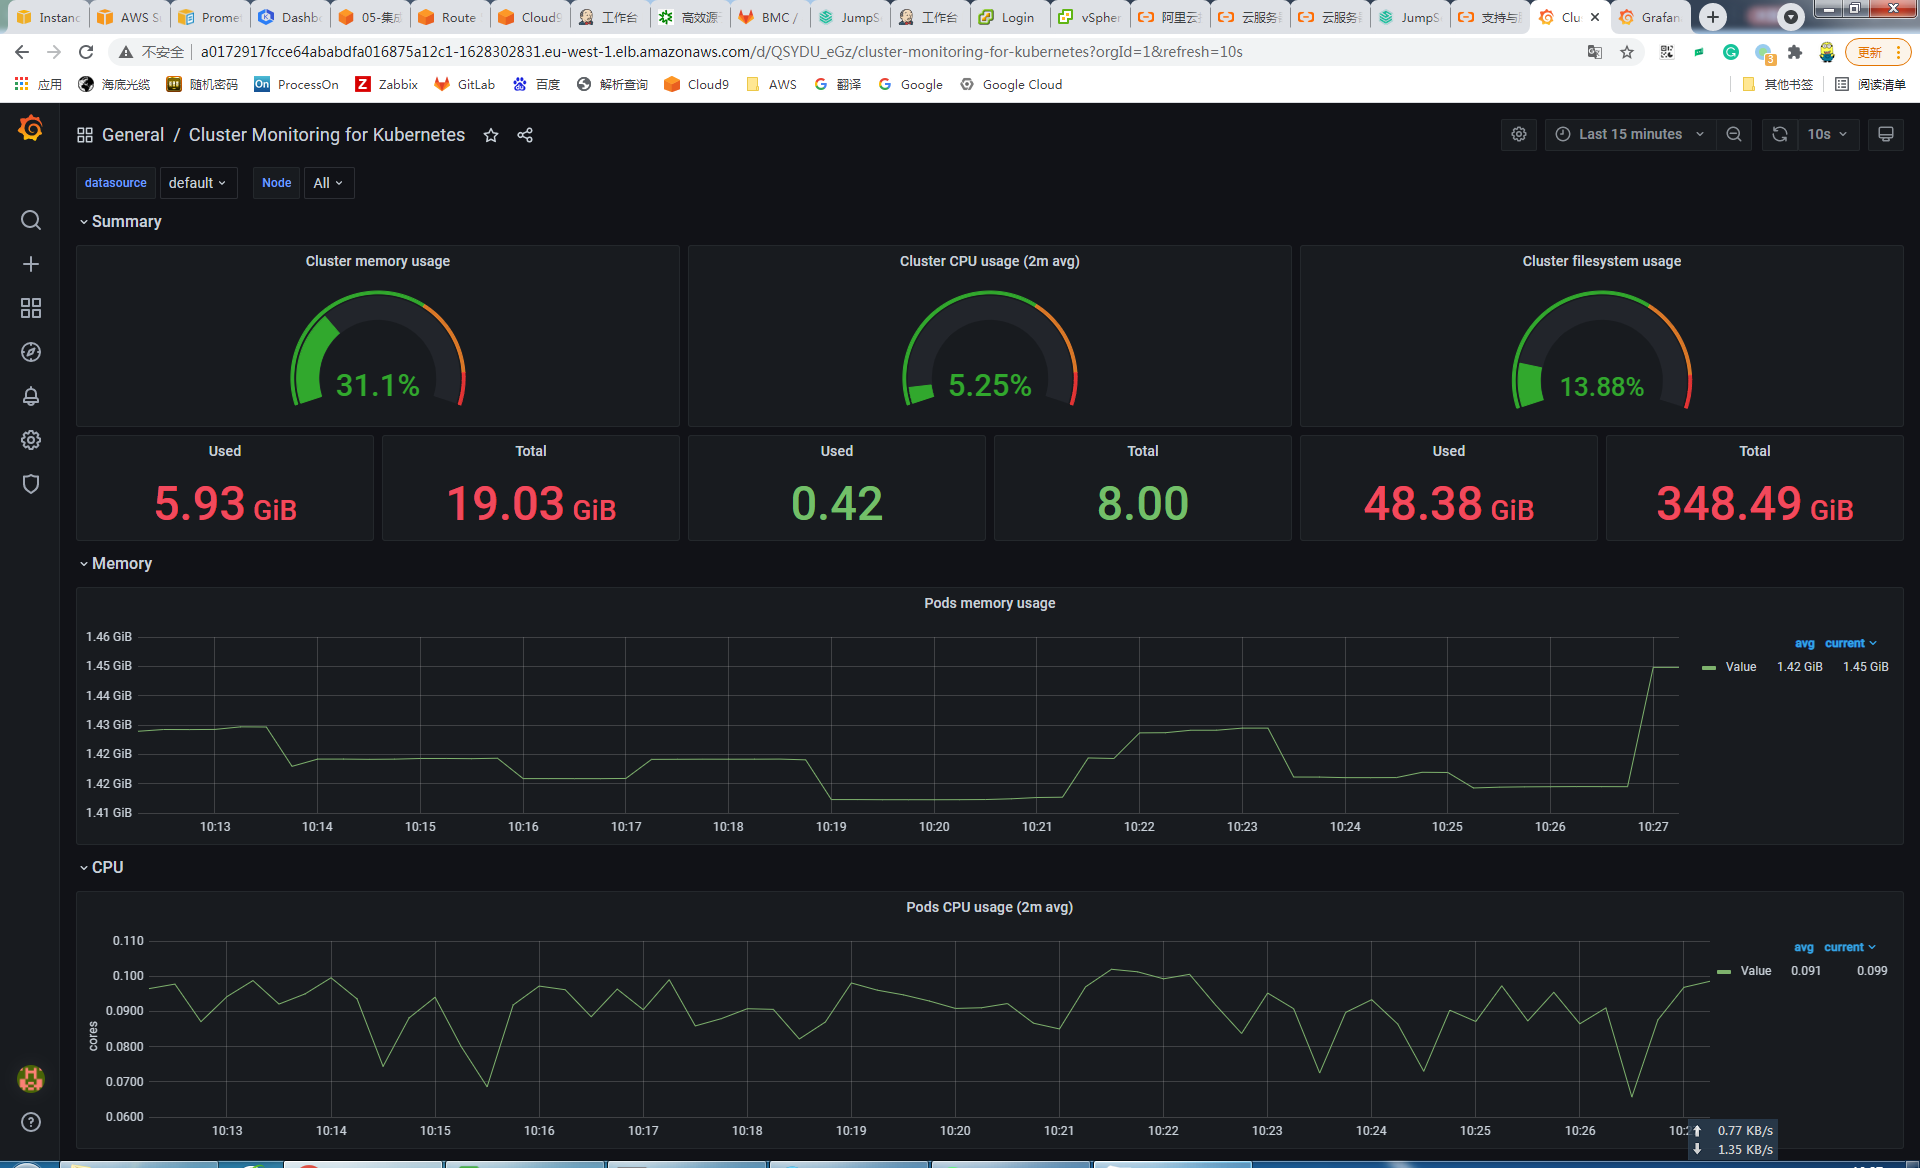
# 配置 Dashboard
点击`+`,选择`import`,然后再[官网](https://grafana.com/grafana/dashboards)查找合适的模版编号。
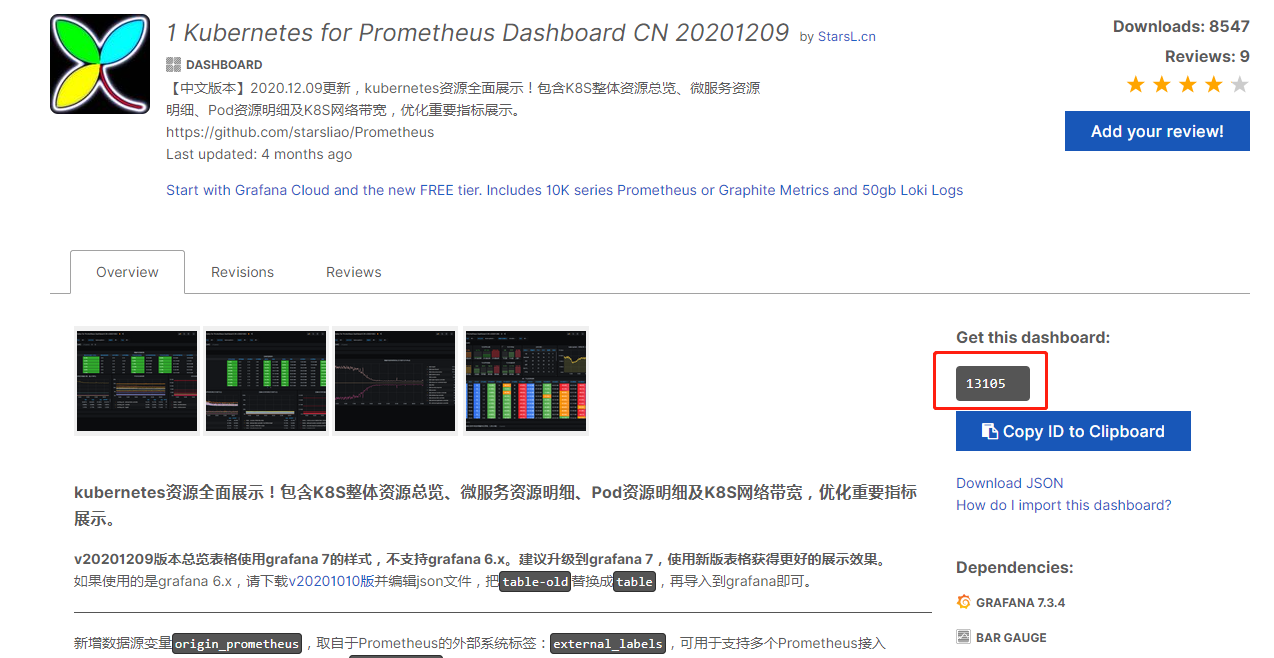
有些模版可能过时了,有些参数数据
显示不出来,需要自行调整 Prom
sql。
# 欢迎大家扫码关注,
获取更多信息

版权声明:本文内容由互联网用户自发贡献,该文观点与技术仅代表作者本人。本站仅提供信息存储空间服务,不拥有所有权,不承担相关法律责任。如发现本站有涉嫌侵权/违法违规的内容, 请发送邮件至 [email protected] 举报,一经查实,本站将立刻删除。


